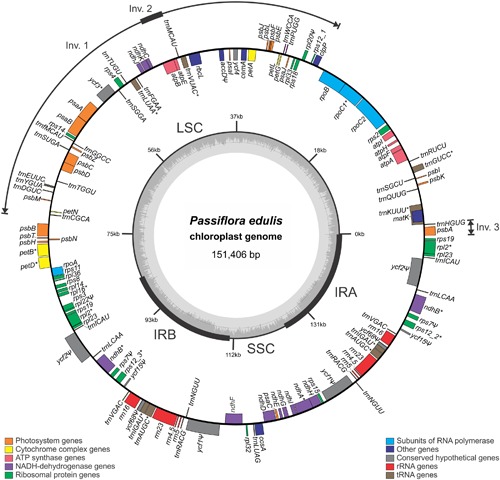
FIGURE 1.

Passiflora edulis chloroplast genome map. Genes are represented as boxes inside or outside the large circle to indicate clockwise (inside) or counter clockwise (outside) transcription. The color of the gene boxes indicates the functional group to which the gene belongs. The thickened lines of the smaller circle indicate IR regions. The inner most circle denotes the GC content across the genome. LSC, large single-copy region; SSC, small single-copy region. Intron-containing genes are marked with ‘*’; Pseudogenes are marked with ‘Ψ.’ Inv., inversion.
