FIGURE 6.

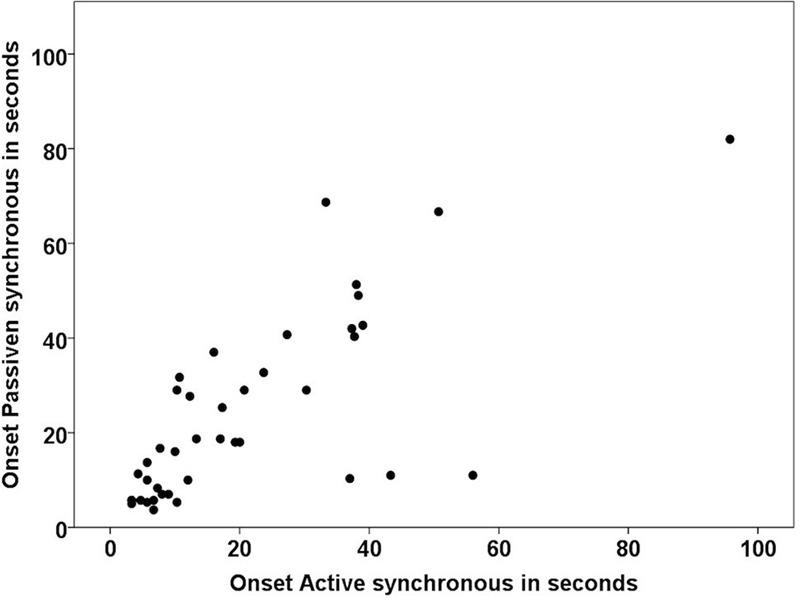
Correlation between the onset times in the active and passive synchronous conditions in the subsample of participants affirming the illusion in both conditions (n = 41).

Correlation between the onset times in the active and passive synchronous conditions in the subsample of participants affirming the illusion in both conditions (n = 41).