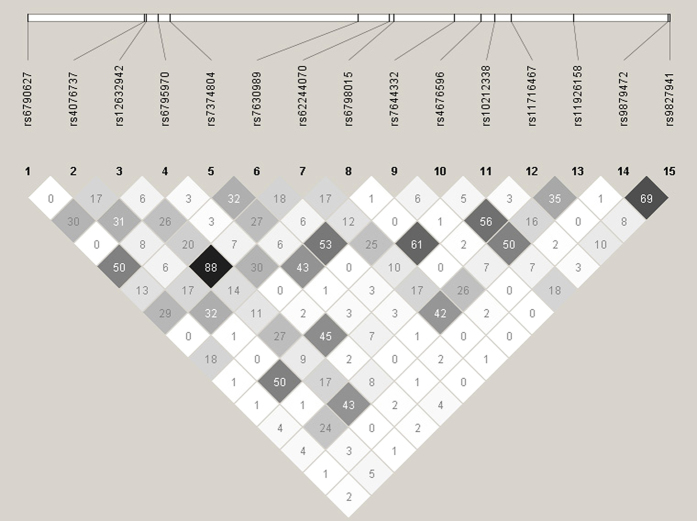
Figure 1. Graphical representation of the linkage disequilibrium (LD) structure in the SCN10A gene region.
This figure shows a graph that represents measurements of LD values (r2) among all possible pairs of SNPs. LD values are expressed as differences in the shade of each colour. White represents a very low r2, and scarlet represents a very high r2. The numbers within the squares represent the r2 values (r2 × 100).

