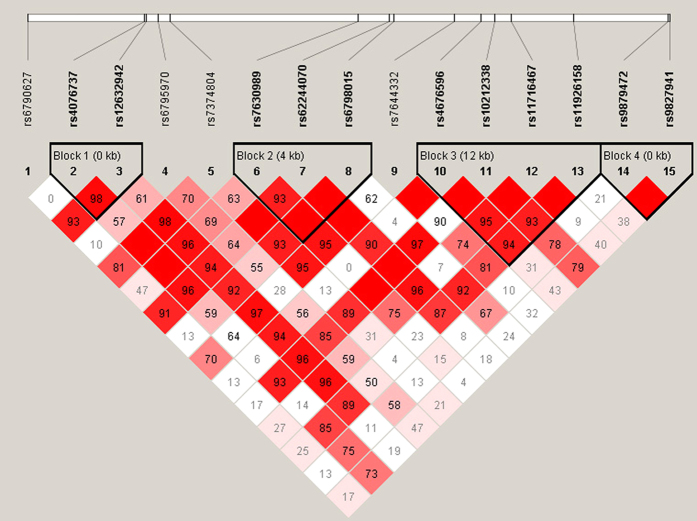
Figure 2. Graphical representation of the haplotype block structure in the SCN10A gene region.
This figure shows a graph that represents measurements of LD values (D’) among all possible pairs of SNPs. LD values are indicated as differences in the shade of each colour. White represents a very low D’, and red represents a very high D’. The numbers within the squares represent the D’ values (D’ × 100). The LD plot was generated using the Haploview programme and the genotype data that were obtained during this study. Haplotype blocks were determined using the default method described in the Gabriel et al. algorithm, and four blocks were identified in this study.

