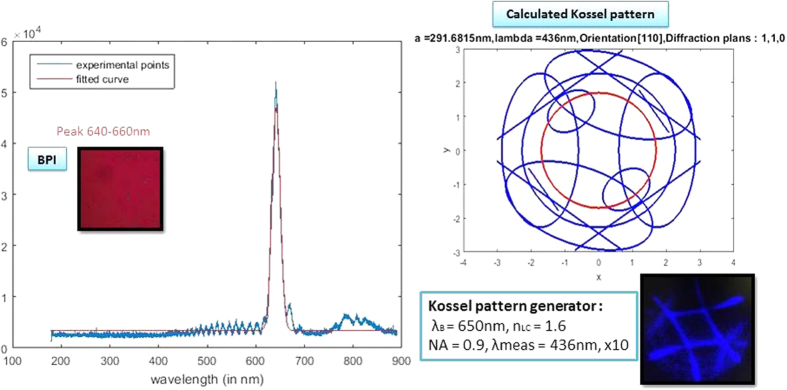
Figure 3. Reflection spectrum measured for the BPI layer with LC-1 mixture (left).
The measured BPI layer is shown in the inset and shows a peak at 650 nm. The Kossel pattern generated from a 650 nm Bragg reflectance peak (top, right) corresponds to a BPI (110) and a calculated lattice size of 292 nm. The red circle is the field of view of the observed Kossel pattern (bottom, right).

