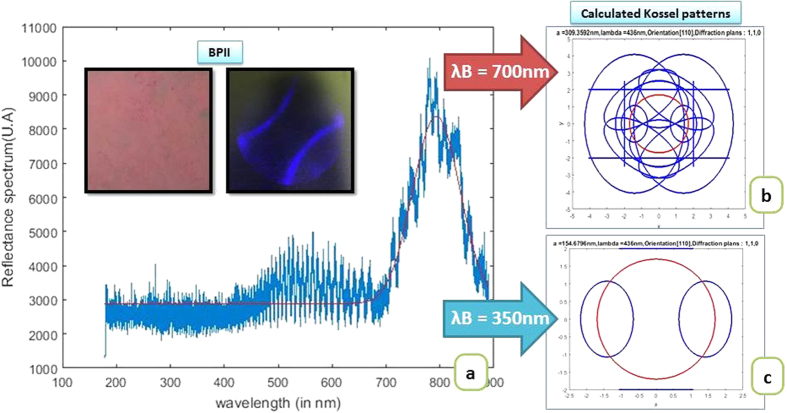
Figure 4.
Reflection spectrum measured for the BPII layer with LC-1 mixture (a). The measured BPII layer and corresponding Kossel pattern are shown in the inset. The spectrum shows a peak at 700 nm. The Kossel patterns calculated for a 700 nm reflectance peak (b) and a 350 nm peak (c), which corresponds to the baseball pattern observed. The red circle is the field of view of the observed Kossel pattern. The calculated lattice size is 155 nm.

