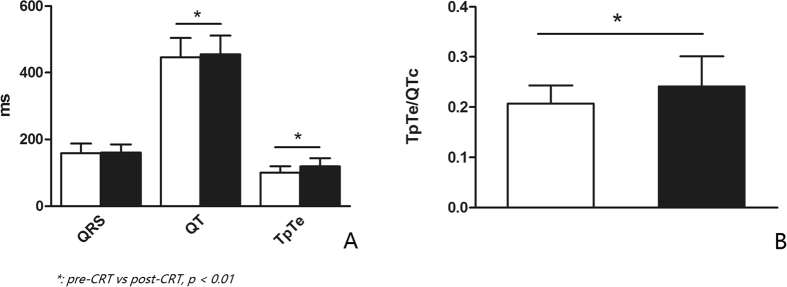
Figure 4. Was the comparison of electrocardiographic indice about dispersion of repolarization between pre-CRT placement and post-CRT placement.
(A) and (B) showed QT interval, TpTe and TpTe/QTc significantly increased within 3 days after CRT implantation indicating CRT prompting TDR increasing in early stage (white bars represented for indices of pre-CRT, and black bars referred to indices of post-CRT).

