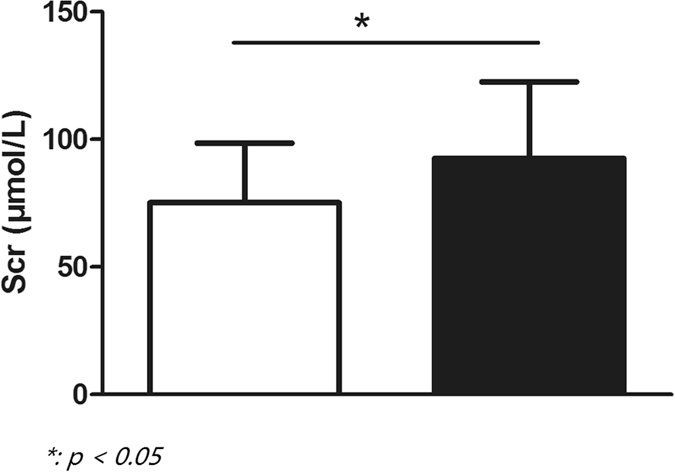
Figure 5. Showed difference of Scr level between CRT responders and CRT non-responders after 1 year.

Bar in white color referred to CRT responders, while bar in black color represented for CRT non-responders.

Bar in white color referred to CRT responders, while bar in black color represented for CRT non-responders.