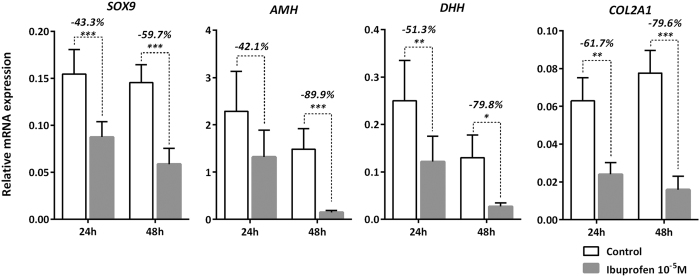
Figure 5. Ibuprofen and Sertoli cell markers.
Quantitative RT-PCR for SOX9, AMH, DHH and COL2A1 were performed on control testes (white bars) and testes treated with 10−5 M of ibuprofen (grey bars) at 24 or 48 h of culture. Each column represents a pool of 11–15 fetal testes. Each bar shows the mean ± SEM of the fold change in target gene expression relative to the RPLP0 reference gene. A non-parametric signed rank Wilcoxon test on paired data was performed (*p < 0.05; **p < 0.01; ***p < 0.001).

