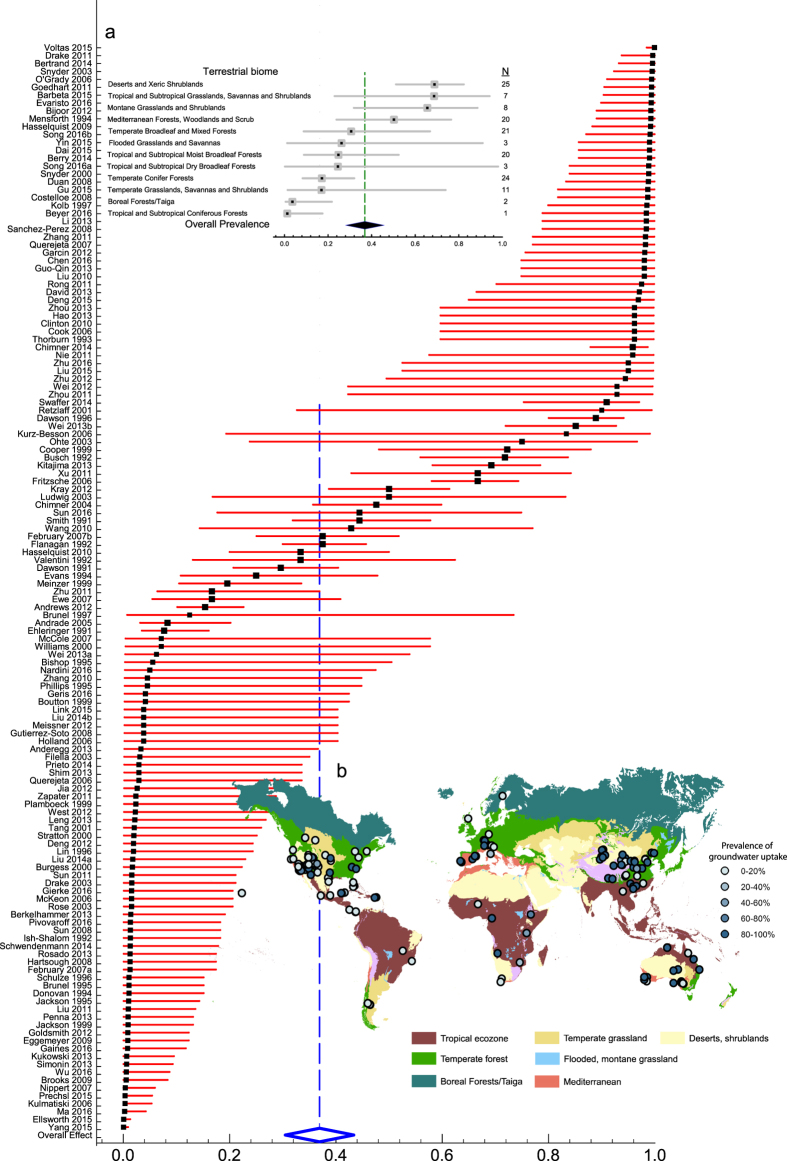
Figure 1. Prevalence of groundwater influence (x-axis: 0 corresponds to no groundwater influence, greater than 0 to groundwater influence).
Main plot, prevalence estimates grouped by source paper (first author-year format). Filled black squares are prevalence point estimates, error bars are 95% confidence intervals (CI, red horizontal lines). Open diamond represents overall prevalence value and its 95% CI is represented by the width of diamond. (a), prevalence estimates grouped by terrestrial biome with N representing corresponding number of sites; (b), Map of prevalence estimates in 162 sites in the global meta-analysis database. Terrestrial biomes delineated by The Nature Conservancy http://www.nature.org. Map was generated using ArcMap 10.2 (http://services.arcgisonline.com/arcgis/rest/services/World_Street_Map/MapServer).

