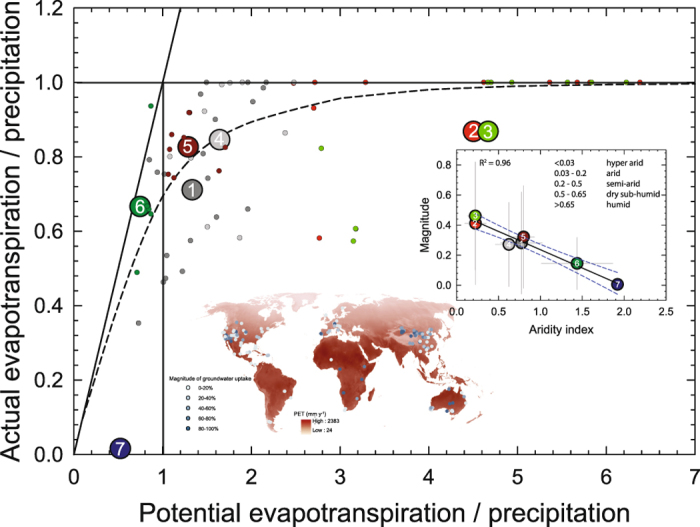
Figure 3. Cluster analysis (self-organizing maps) plot in evaporative index (actual evapotranspiration/precipitation166) as a function of dryness index (potential evapotranspiration.

180/precipitation). Actual evapotranspiration (AET) was calculated as the difference between precipitation and streamflow181. Small dots are sites in cluster analysis with colors representing corresponding cluster assignments. Inset, magnitude estimates of cluster assignments as a function of aridity index. Error bars are 1 SD. Also shown is the generalized climate classification scheme for global aridity index180 and map of magnitude of groundwater influence over potential evapotranspiration (PET) layer (mm y−1) annual average 1950–2000180. Map was generated using ArcMap 10.2 (http://services.arcgisonline.com/arcgis/rest/services/World_Street_Map/MapServer).
