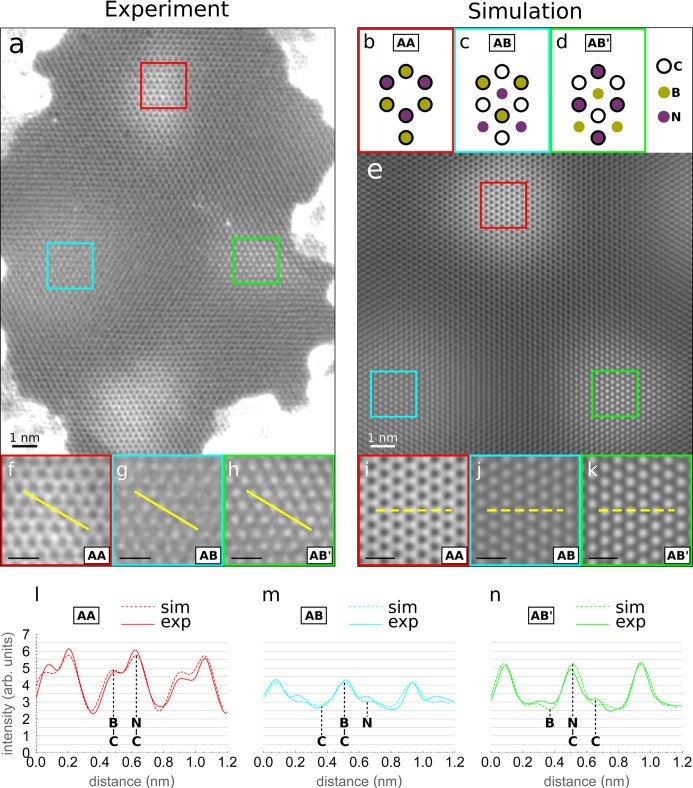
Figure 2.
MAADF imaging. (a) Atomically resolved MAADF image of a portion of the heterostructure. Because of the contrast mechanism for medium angle scattering, high-symmetry regions appear brighter. The top-view structure models of the high-symmetry regions are shown in panels b–d. The regions in the colored squares of panel a are shown at higher magnification in panels f–h. (e) STEM MAADF simulation of the considered heterostructure. (i–k) Magnified views of the three high-symmetry regions of (e). (l–n) Gray value intensity profiles for the experimental (solid lines) and the simulated (dashed lines) case along the yellow lines in f–k. Scale bars in panels f–k are all 0.5 nm.

