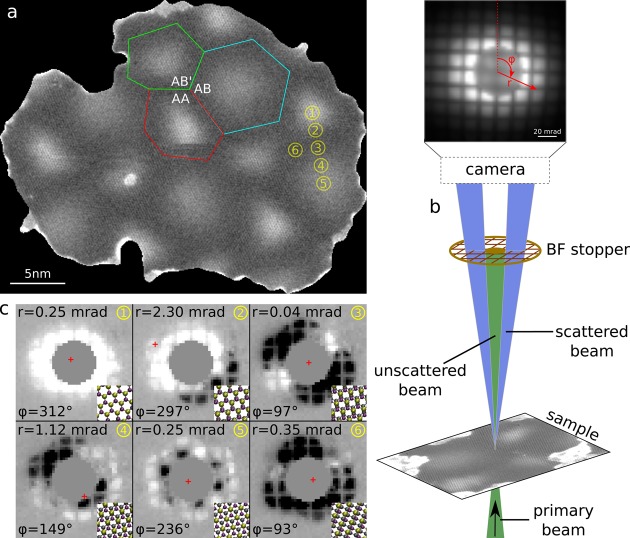
Figure 3.
(a) MAADF image of an area of the sample containing several moiré regions. The AB stacked region (enclosed in the cyan polygon) is found to be consistently larger than the AA (in red) and the AB′ (in green) regions. (b) Schematics of the experimental setup used for direction sensitive detection of the scattered electrons, including an example exposure recorded by the CCD camera and the polar coordinate system used to describe the position of the ACOM. (c) From the indicated regions (1–6) in panel a, the scattering intensity distributions are shown as the difference between a 10 × 10 pixels area binned signal and a reference signal that is obtained as an average of all recorded images (excluding those corresponding to contamination). Insets illustrate the local relative lattice offsets that are associated with the asymmetric scattering intensity. The red cross indicates the position of the ACOM in each image (the radial coordinate was exaggerated by a factor of 20). The r and φ coordinates of the ACOM position are also indicated for each image.

