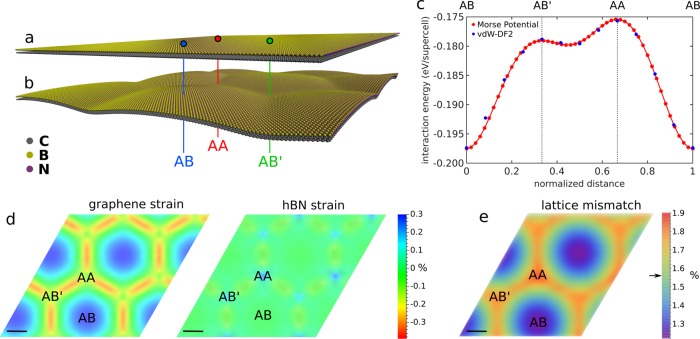
Figure 6.
Results of calculations. (a) Rigid structure model of the graphene/hBN bilayer before relaxation. (b) Structure model of the graphene/hBN bilayer after full relaxation. The relaxed model visibly distorts in the out-of-plane direction. (c) Interlayer interaction energy plot per supercell (four carbon, two boron, and two nitrogen atoms). The blue dots represent the values obtained by DFT calculations for different stacking configurations, while the red dots indicate the shape of the Morse potential, whose parameters were optimized to fit to the DFT points. (d) In-plane strain maps of graphene (left) and hBN (right). (e) Lattice mismatch map. The black arrow next to the color bar indicates the initial lattice mismatch between the two crystals before the relaxation. Scale bars in panels d and e are 2 nm.

