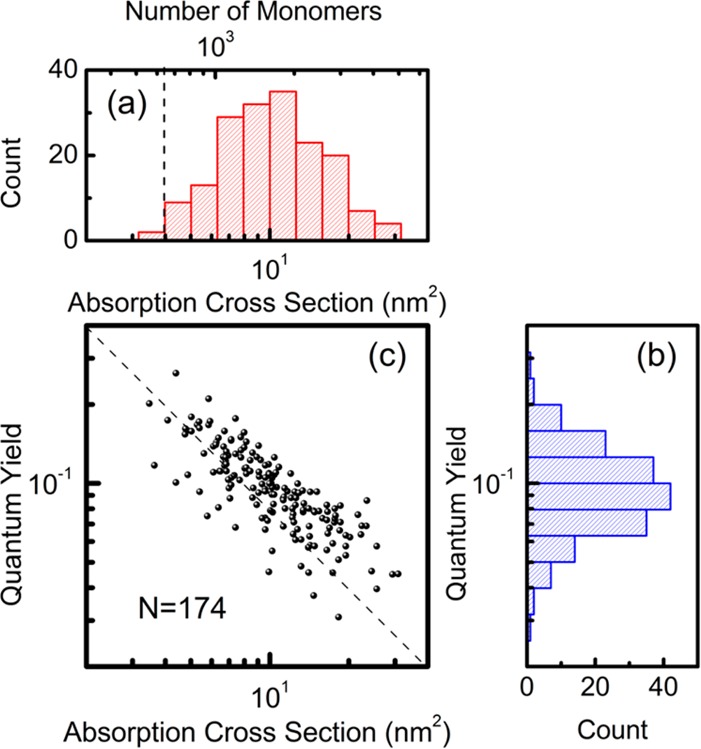
Figure 3.

Absorption cross-section and quantum yield of single MEH-PPV molecules in PMMA matrix. (a) Histogram of the absorption cross-section (bottom axis) and the number of monomers (top axis) of single MEH-PPV molecules. The dashed line indicates the current photothermal detection limit. (b) Histogram of the quantum yield of single MEH-PPV polymers deduced from the simultaneous measurements. (c) Scatter plot of the quantum yield versus the absorption cross-section. The dashed line has slope −1 and indicates a decrease of the quantum yield as the inverse of the absorption cross-section.
