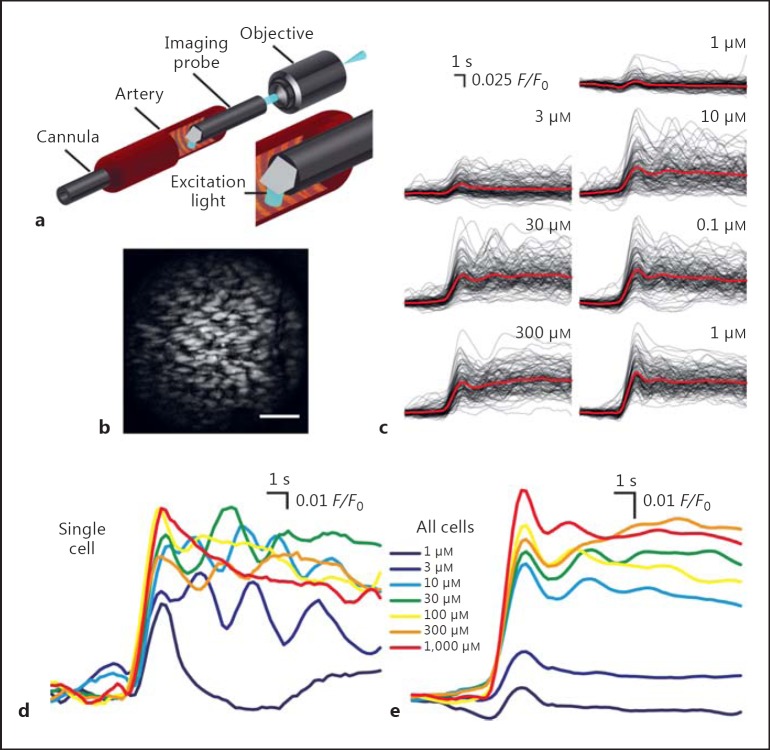
Fig. 1.
Population-wide concentration-dependent response in the endothelium of pressurized arteries from aged animals. a A simplified schematic diagram that illustrates GRIN microendoscopy of pressurized arteries. The cannula (left side) was used to pressurize the arteries. b An image of the endothelium obtained by probing the lumen of a pressurized (60 mm Hg) carotid artery from an aged (18-month-old) rat. Scale bar, 100 μm.c Representative baseline corrected and time-aligned (F/F₀) Ca2+ signals (black lines) and average (red lines; see online version for colors) of a population of endothelial cells, imaged across a single FOV, in response to various concentrations of ACh (60 mm Hg). d Individual traces of the Ca2+ levels in a single endothelial cell (from data shown in c) illustrating the evolution of the Ca2+ response of a single cell as the level of activation (ACh concentration) is increased. e Average endothelial Ca2+ activity (derived from traces shown in c), showing the increased Ca2+ responses to increasing ACh concentrations. The averaged response is the combined activity of the number of cells activated and the amplitude of the response in the field of cells.

