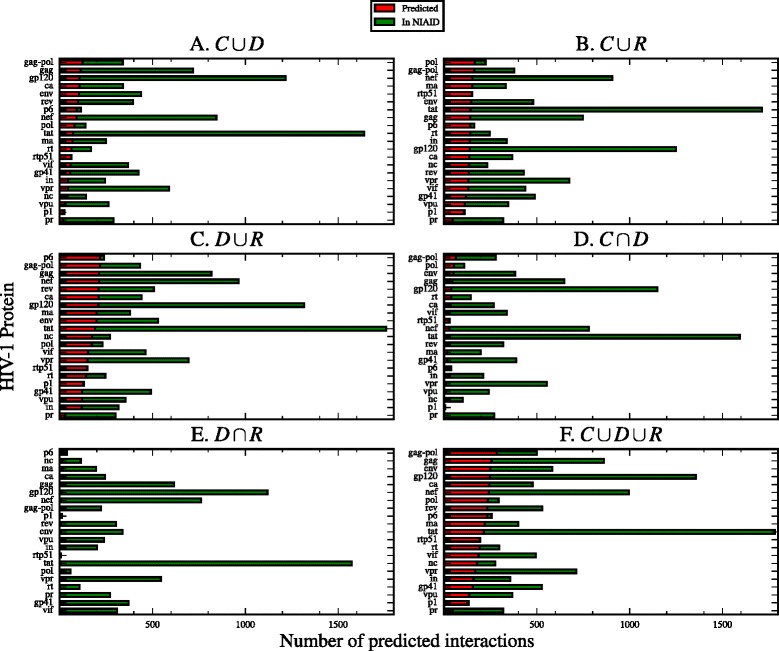
Fig. 6.

Number of predicted interactions per SLiM set. The number of predicted interactions by SLiM set, contrasted with the number of interactions in the NIAID HIV-1 Human Interaction Database. The number of predicted interactions is represented with a red bar. The green bar represents the total number of interactions in the NIAID database
