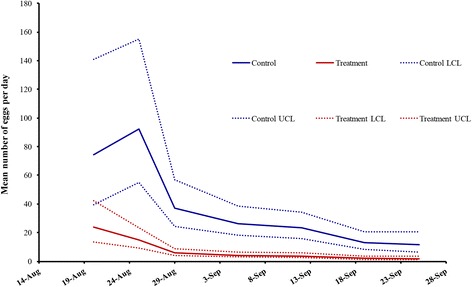
Fig. 3.

Least square means for treatment (red line) and control (blue line) sites with 95% confidence intervals for egg accumulation from oviposition cups and observed weekly mean egg counts by site. Five oviposition cups were deployed per hot spot each week for 7 weeks (one trap failure in the first week of trapping). Egg data were collected after the autodissemination stations were placed
