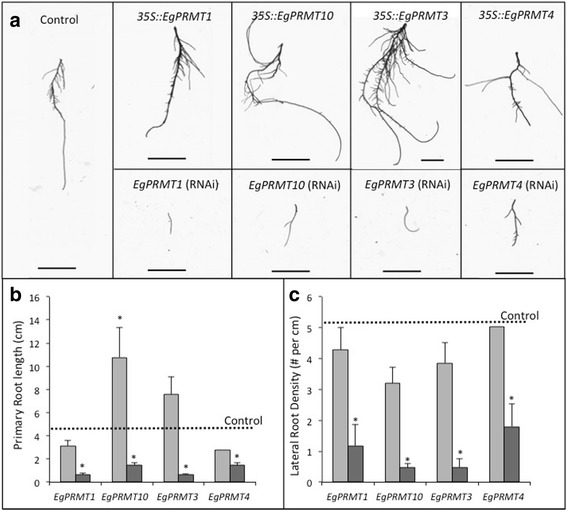
Fig. 5.

Effect of differential gene regulation of EgPRMTs on root growth and lateral branching. a Appearance of typical control or transformed roots either overexpressing (35S::) or underexpressing (RNAi) PRMT homologues. Scale bar = 1 cm; b Length of primary roots differentially expressing different PRMT genes (35S:: − light grey; RNAi – dark grey) averaged over all independent transformants generated. Dashed line represents average length of control primary roots. c Frequency of lateral root formation averaged over all independent transformants (35S:: − light grey; RNAi – dark grey). Dashed line represents average number of lateral roots per cm on control roots. ± SE; * = Significant difference from control (p < 0.05)
