Fig. 2.

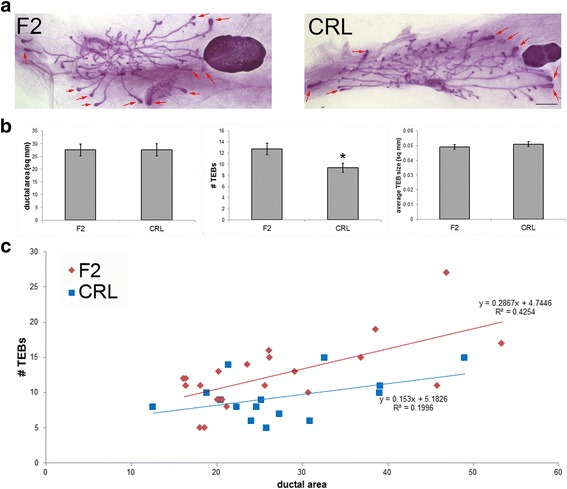
CRL females have fewer TEBs compared to F2 females at PND24. a Representative whole mount mammary glands from F2 and CRL females at PND24. Scale bar = 1 mm. Examples of TEBs are indicated by red arrows. b Quantification of three parameters of the female mammary gland, ductal area (left), number of TEBs (middle), and average TEB size (right). CRL females had fewer TEBs but no differences in TEB size or ductal area compared to F2 females. *, p < 0.05. c Linear regression analyses reveal positive associations between ductal area and number of TEBs in both F2 and CRL females. F2 females typically had more TEBs per square millimeter of ductal area compared to CRL females
