Fig. 3.

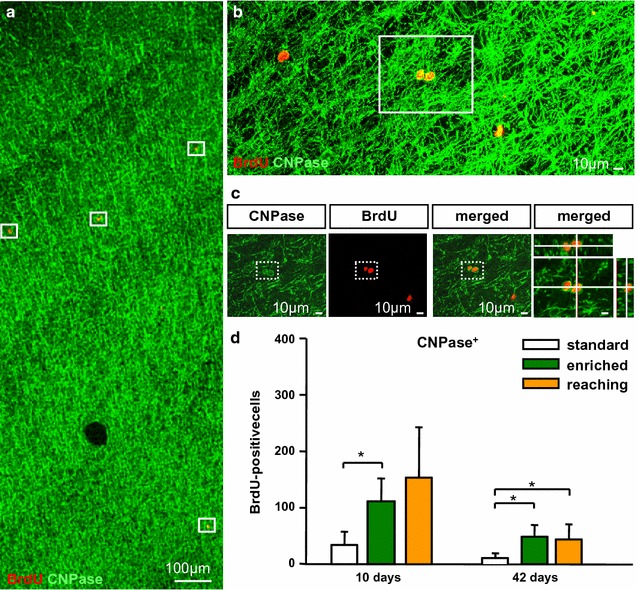
Activity-dependent increase of BrdU+CNPase+ cells in the sensorimotor cortex. a Confocal images of double-labelled sections with antibodies against BrdU (red) and CNPase (green). b Maximum intensity projection showing BrdU+ nuclei co-localisation with CNPase. c Higher magnification of (b) showing single confocal planes by z-stack co-labeling of BrdU+ with CNPase+. Counted cells were typically surrounded by CNPase expression (in the frame). d Graph depicting the number of BrdU+CNPase+ which increased after enriched environment housing and reaching training at day 42 compared to standard conditions. Bars represent mean ± SD. Asterisks indicate significant differences (P < 0.05). Scale bars represent a 100 µm, b, c 10 µm
