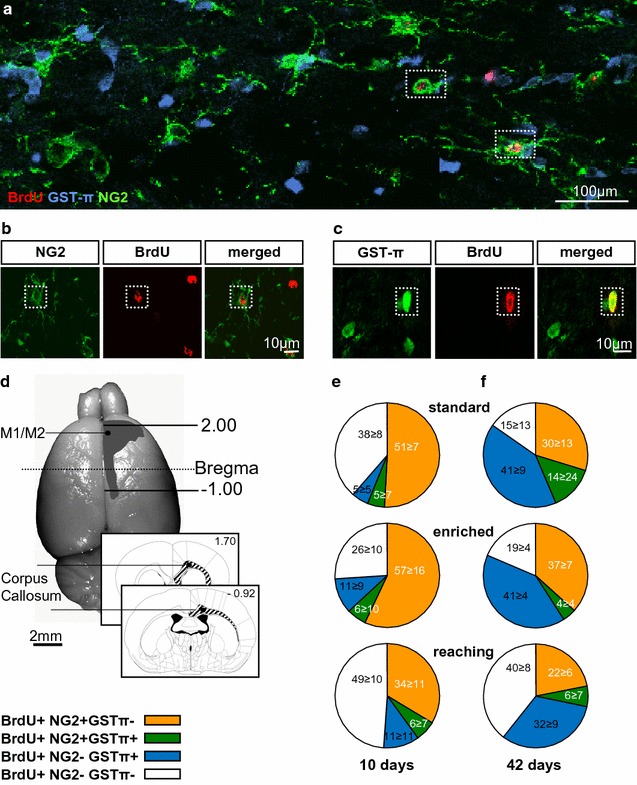
Fig. 5.

Percentage of distinct oligodendrocyte precursor cells in the corpus callosum of the different experimental groups. a Confocal overview image of triple-labelled sections with antibodies against BrdU (red), GSTπ (blue) and NG2 (green). b Single confocal planes by z-stack co-labeling of BrdU+ with NG2+. c Single confocal planes by z-stack co-labeling of BrdU+ with GSTπ+. d The schematic detailed picture below shows areas analysed [39]. e, f The distribution of the BrdU+ cells between the different activity conditions at days 10 (e) and 42 (f). Scale bars a 100 µm, b, d 10 µm
