
Fig. 3.
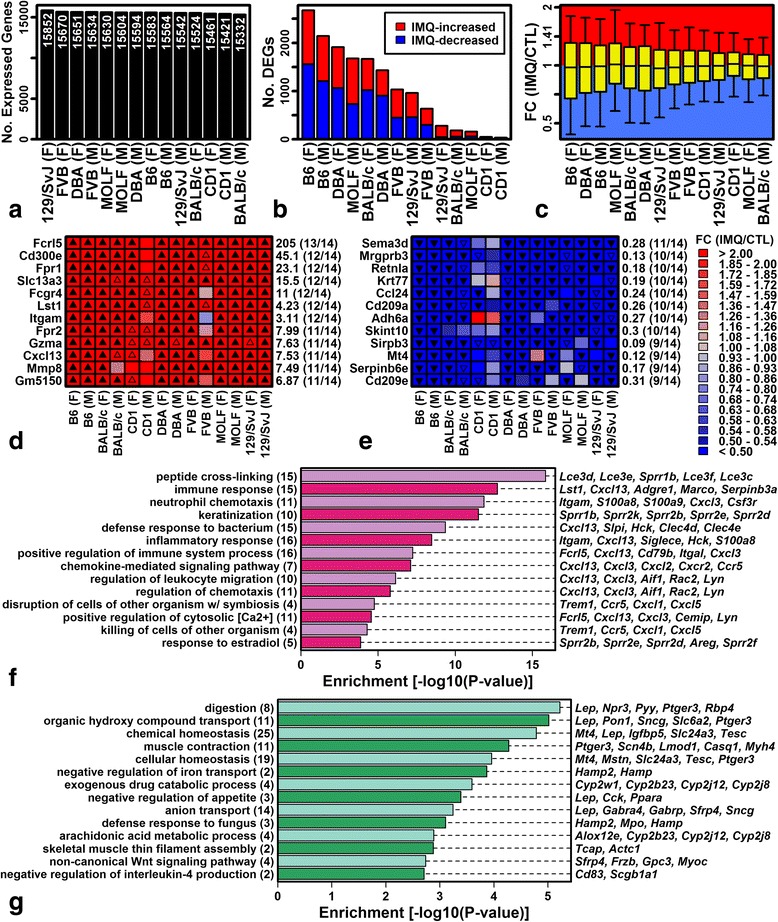
Differential expression with IMQ treatment. a Number of expressed protein-coding genes. b Number of differentially expressed genes (DEGs; IMQ-increased, fold change (FC) >2.0 with FDR <0.10; IMQ-decreased, FC <0.50 with FDR <0.10). c FC distributions (IMQ/CTL). Boxes outline the middle 50% of FC estimates (whiskers, 10th and 90th percentiles). d, e Genes most frequently increased (d) or decreased (e) by IMQ treatment. f, g Gene Ontology biological process terms significantly overrepresented among genes most frequently increased (f) and decreased (g) by IMQ. Values in parentheses (left margin) indicate the total number of IMQ-increased (f) or IMQ-decreased (g) genes associated with each term. The right margin lists example IMQ-increased/decreased genes associated with each term. F female, M male