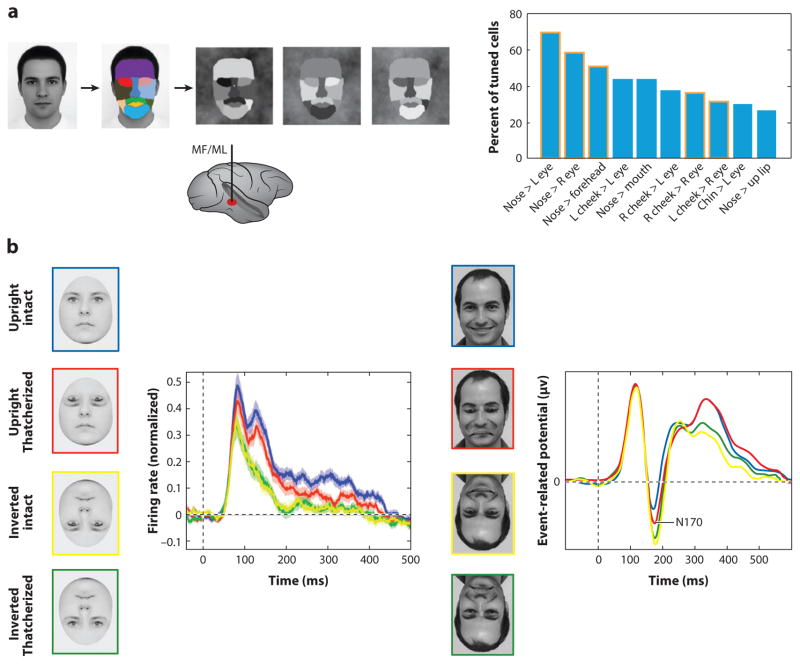
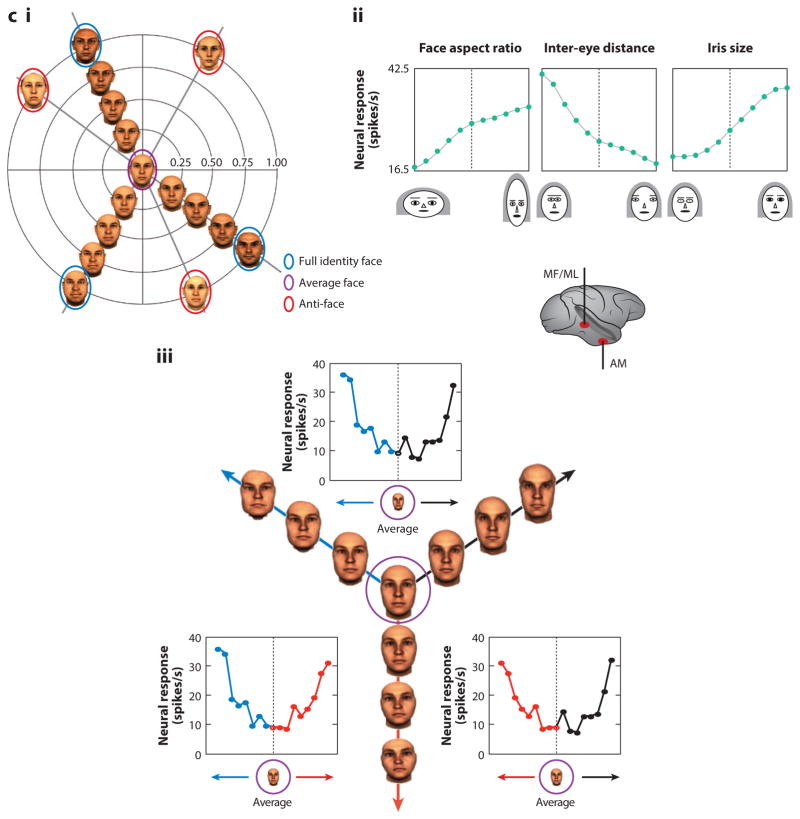
Fig. 2. Mechanisms for Face Detection, Holistic Face Processing, and Face Space.
a. (left) To generate stimuli that probe selectivity for coarse-contrast face-stimuli, a front-view picture of a face was segmented into eleven areas, to which eleven luminance values were then randomly assigned (Ohayon et al 2012). Recordings from the middle face patches (MF/ML, bottom) during stimulus presentation revealed selectivity of cells to the polarity of a large fraction of all possible contrast pairs and dominance of a single polarity for each pair. (Right) Histogram of ten most common contrast polarity features and their relative proportion in the cell population. The top two contrast polarity features express higher luminance for the nose region than left and right eye, respectively. Five of these contrast features and their polarity were predicted by human psychophysics (columns outlined in orange).
b. Effects of “Thatcherizing” faces on face-selective responses in single units from face area ML (left) and the evoked potential from the right occipito-temporal electrode in humans (right). Left: Face cells in ML differentiate between intact and Thatcherized upright faces (blue and red), but not between intact and Thatcherized inverted faces (green and yellow) (Taubert et al 2015b). This is consistent with the behavioral Thatcher illusion first reported by Thompson (Thompson 1980). Right: Event related potentials to Thatcherized and intact upright and inverted faces recorded from a right occipito-temporal EEG electrode in humans also show a difference in the amplitude of the N170 between intact and Thatcherized upright faces but no difference for inverted faces (Carbon et al 2005).
c. i Two dimensional depiction of perceptual face space (Leopold et al 2001). The space is centered on an average face. Each face occupies a particular location in face space based on its deviation from the average face along many dimensions. Faces along the same trajectory originating at the average face all have the same identity, but faces further from the average face have greater identity strength and are therefore more distinctive. An anti-face is a face on the opposite side of the average face from a face with an equal identity strength. Aftereffects for opposite adaptor pairs are greater than aftereffects for non-opposite faces matched for perceptual similarity.
ii Facial feature selectivity of a middle face patch neuron (Freiwald et al 2009). Macaques viewed cartoon faces that varied randomly along nineteen dimensions, each with feature values ranging from one extreme (−5) to another (+5) (valence arbitrary). Typical cells were tuned to small subsets of feature dimensions (here four) and exhibited ramp-shape tuning curves with minimal responses elicited by one feature extreme and maximal responses by the opposite feature extreme. Thus tuning curves spanned face space. The sample neuron shown here was modulated by face aspect ratio (preferring narrow faces), inter-eye distance (preferring narrowly spaced eyes), eye aspect ratio (preferring wide eye shapes), and iris size (preferring large).
iii. Response of a face-responsive cell, recorded likely in AM to stimulus trajectories originating in the average face. The center figure illustrates stimuli shown and their organization along three trajectories (red, blue, black) originating in the center of face space. For all trajectories, the neuron’s firing rate increased with distance from the center of face space.


