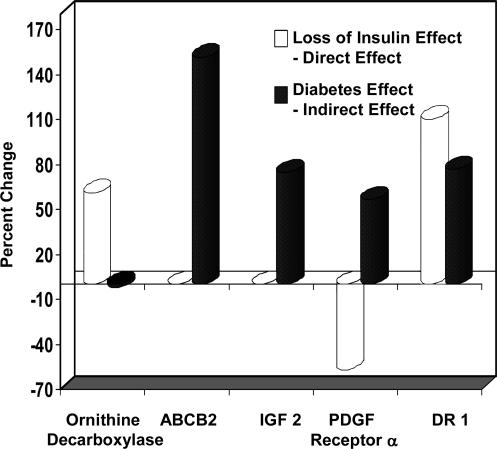
Fig. 3.
The “loss-of-insulin effect” and the calculated “diabetes effect” are shown for representative genes. The loss-of-insulin effect was calculated from the percentage of change in expression in the MIRKO as compared with the Lox controls. The diabetes effect was calculated as the difference between the percentage of change in the MIRKO-STZ and MIRKO when compared with the Lox controls (Table 5, which is published as supporting information on the PNAS web site).

