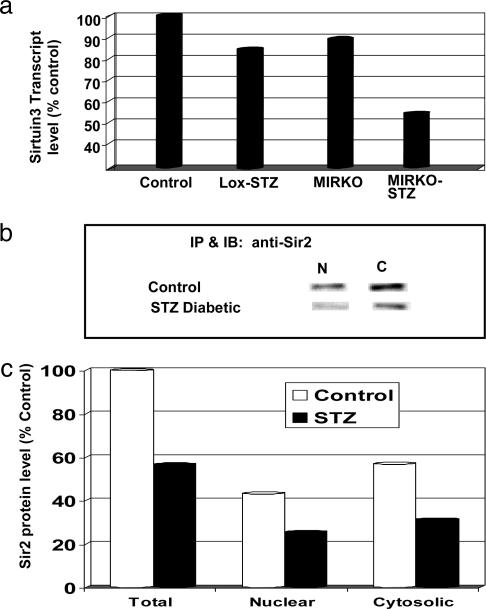
Fig. 5.
Changes in Sirtuin3 and sir2 with diabetes. (a) The mean transcript levels of Sirtuin3 in skeletal muscle in the various metabolic groups, as detected by microarray analysis, are shown as a percentage of the level in the control group. (b) The bands for sir2 in the nuclear (N) and cytosolic (C) fractions from the hind-limb muscles of wild-type control and STZ-induced diabetic mice are shown on immunoblots (for detailed methods, see Supporting Materials and Methods). (c) The mean intensity of the nuclear and cytosolic fraction sir2 bands on immunoblotting from two control and two diabetic mice are shown. The total is the sum of the respective nuclear and cytosolic fractions. The levels are represented as a percentage of the mean total level in the control group.

