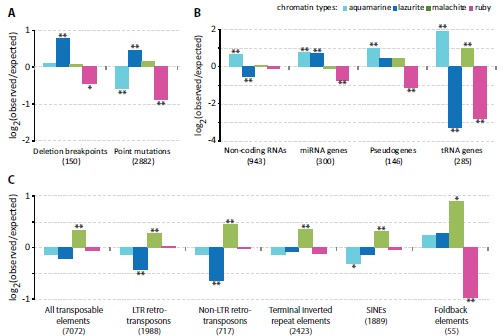
Fig. (3).

Enrichment and depletion of the four chromatin types with genomic features. Y axis shows log2-transformed ratio of the observed numbers of genomic features to the expected ones. Single and double asterisks indicate P < 0.02 and P < 0.001, respectively (Pearson’s chi-square goodness of fit test). A. Distribution of deletion breakpoints and missense/nonsense point mutations in the chromatin types. B. Distribution of non-coding RNAs, pseudogenes, miRNA and tRNA genes in the chromatin types. C. Relative enrichment and depletion of the four chromatin types with natural transposable elements (all) and individual classes thereof (LTR retrotransposons, non-LTR retrotransposons, terminal inverted repeat elements, SINEs, Foldback elements).
