
Fig. (4).
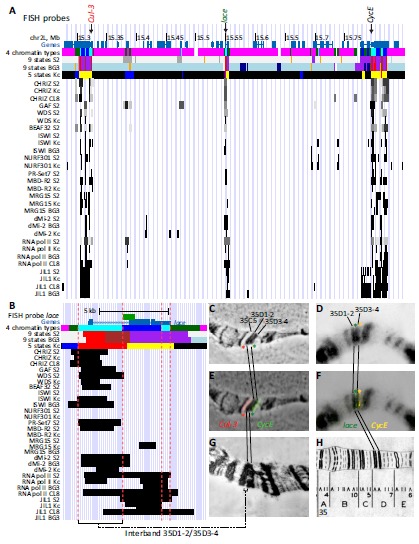
FISH mapping of 35D1-4 region of salivary gland polytene chromosomes on the molecular map. А. Physical map of the 35D1-4 region: genomic coordinates, distribution of chromatin types predicted by different models (“4 types” [10], “9 states S2” [73], “9 states BG3” [73] and “5 states” [14]) and regions of significant enrichment of interband-specific proteins [13]. Positions of the probes used for FISH are shown by arrows at the top. B. Physical map of the 35D1-2/35D3-4 interband encompassing the lace gene. Red dashed lines show borders of the two aquamarine regions in the 35D1-2/35D3-4. C-H. FISH mapping of DNA probes from the Cul-3 gene (marks the distal border of band 35D1-2), lace gene (marks interband 35D1-2/35D3-4) and CycE (marks the proximal border of the band 35D3-4). C. Phase-contrast photograph. D. DAPI signal (DNA, inverted image). E, F. Merged image of hybridization signals and phase-contrast or DAPI channel. G. Electron microphotograph of the region 35BE. F. Bridges’ map [85].