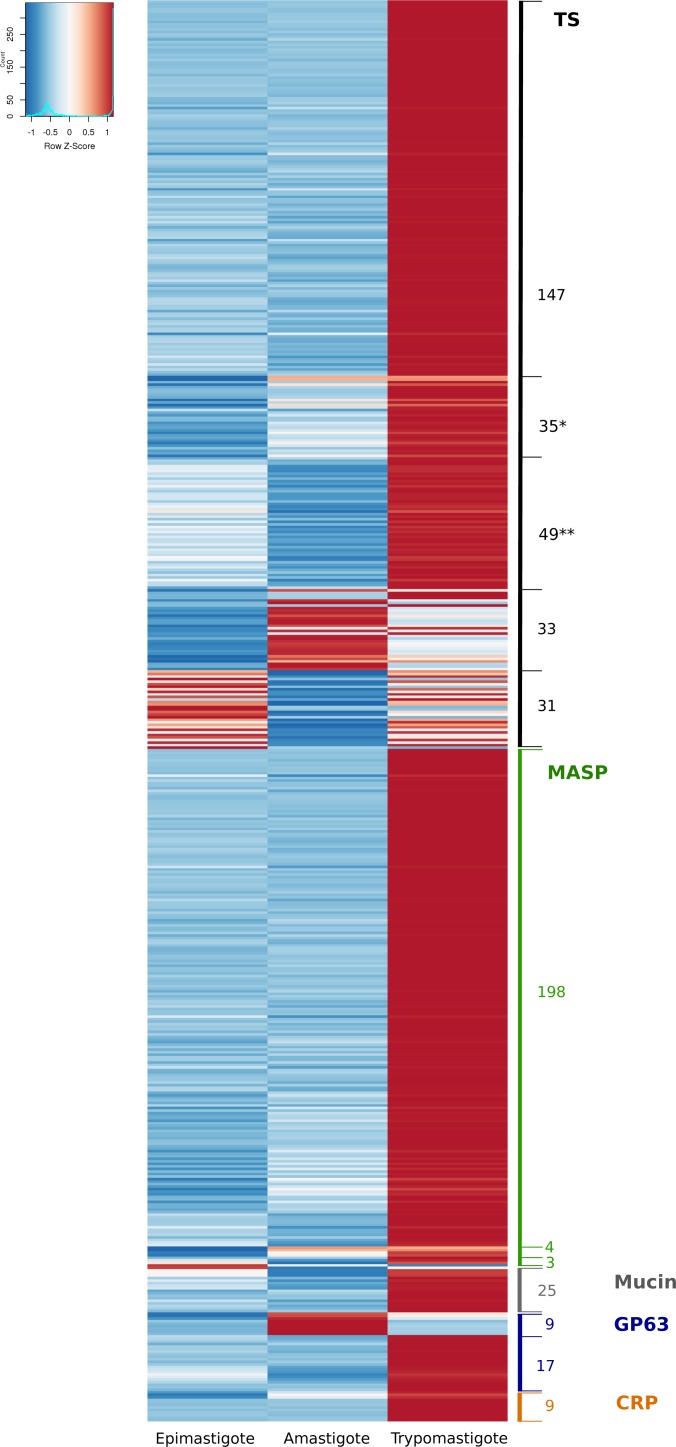
Figure 1. Differential expression of the surface components.
Heatmap of glycoprotein genes significantly regulated during the life-cycle of Trypanosoma cruzi. The z-score is plotted, red bars represent up-regulation and blue bars represent down-regulation. Numbers correspond to number of genes. (*) remarks TS genes barely expressed in epimastigotes. (**) remarks TS genes barely expressed in amastigotes. A total of 31 and 33 TS genes were up-regulated in epimastigotes and amastigotes, respectively. Of these, 19 and 18 genes were also up-regulated in trypomastigotes. The total number of Trans-sialidases up-regulated in trypomastigotes is 268.

