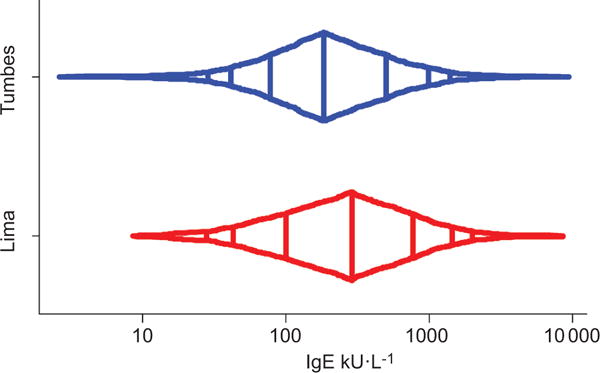
FIGURE 1.

Distribution of total serum IgE stratified by site; Peru, 2009–2010. x-axis is in log-scale. Vertical lines inside the box-percentile plot represent, from left to right, the 5th, 10th, 25th, 50th, 75th, 90th and 95th percentiles, respectively.
