
FIGURE 3.
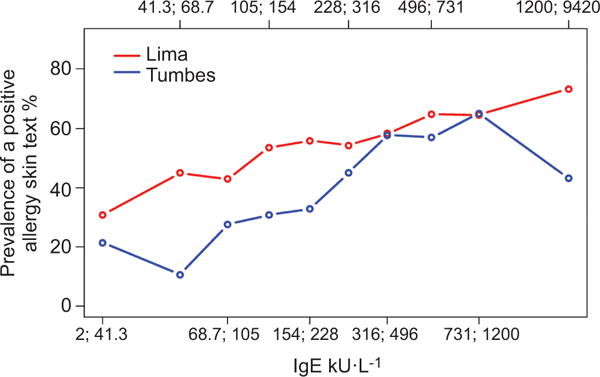
Prevalence of atopy by deciles of total serum IgE stratified by study site; Peru, 2009–2010. Decile interval values are indicated as x;y corresponding to values greater than x and including y.
Official websites use .gov
A
.gov website belongs to an official
government organization in the United States.
Secure .gov websites use HTTPS
A lock (
) or https:// means you've safely
connected to the .gov website. Share sensitive
information only on official, secure websites.
Prevalence of atopy by deciles of total serum IgE stratified by study site; Peru, 2009–2010. Decile interval values are indicated as x;y corresponding to values greater than x and including y.