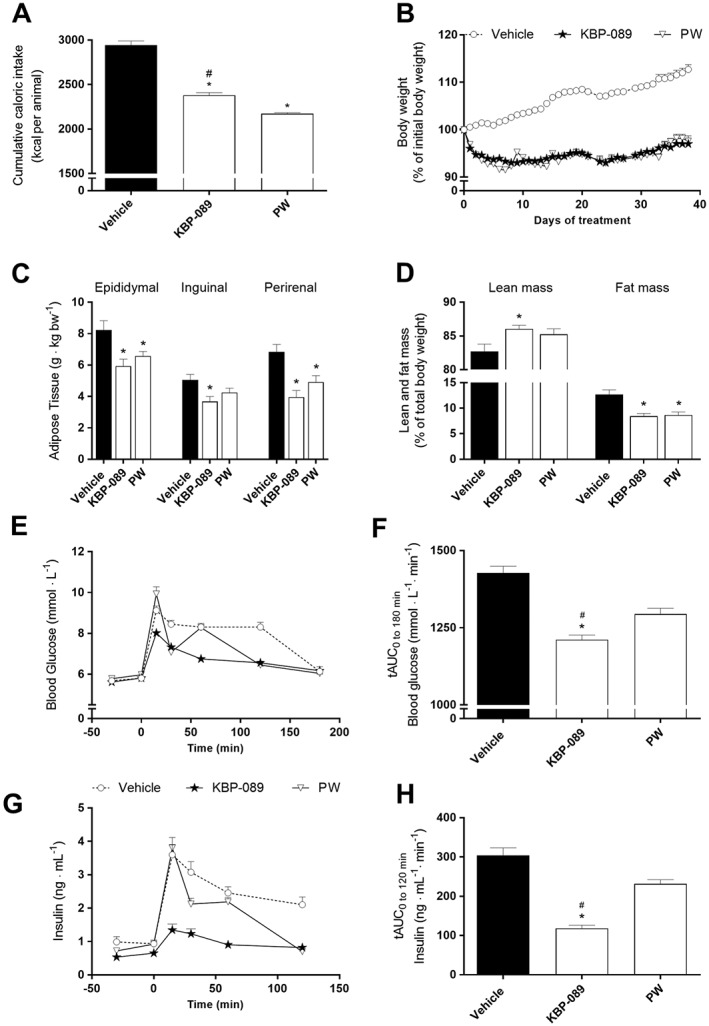
Figure 5.

KBP‐089 and weight‐matched rats. (A) Cumulative caloric intake at study end. (B) Daily body weight and (C) relative weight of epididymal, inguinal and retroperitoneal adipose tissue at study end in HFD rats treated with KBP‐089 (2.5 μg·kg−1) and weight‐matched rats. (E, G) Plasma glucose and plasma insulin respectively and (F, H) total AUC of glucose and insulin respectively during OGTT after 3 weeks (n = 12 rats per group). Statistical analysis between the groups was evaluated by an ordinary one‐way ANOVA with Tukey's multiple comparisons test (C, F, H) or (D) Kruskal–Wallis with Dunn's multiple comparisons test. *P < 0.05 compared with vehicle, # P < 0.05 compared with PW.
