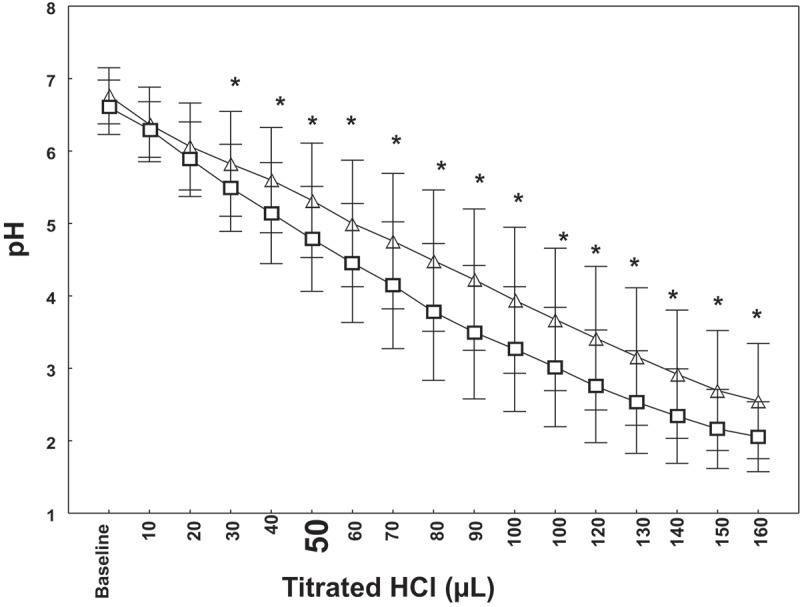
Figure 1.

pH titration curve of exclusive waterpipe smokers (EWPS, n = 36) and non-smokers (n = 36). Data are mean (□ for non-smokers and ∆ for EWPS) and standard deviation ( ). *Student’s t-test p < 0.05: non-smokers vs. EWPS for the same volume of HCl.
