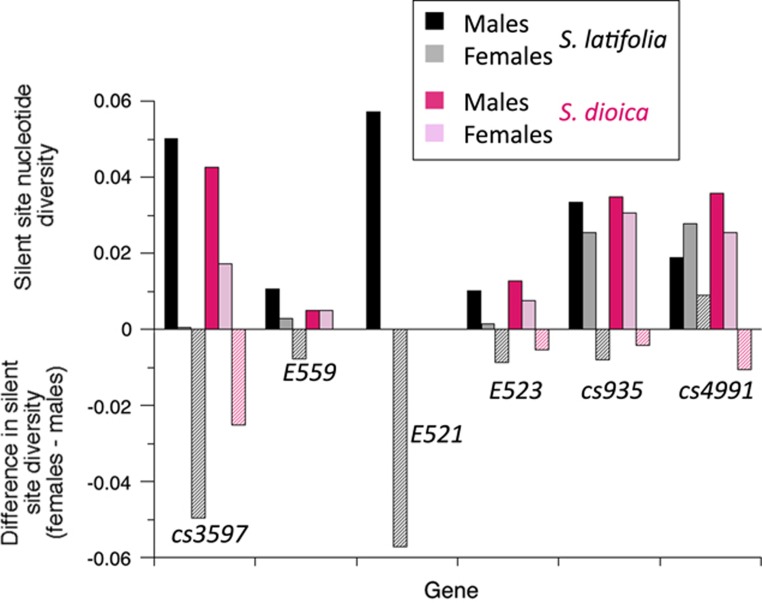
Figure 2.
Comparisons of nucleotide diversity in males and females of S. latifolia and S. dioica, as indicated in the key. The estimated diversity values for silent sites are shown above the x axis, and the differences in diversity between males and females are shown below the axis. Note that there are no values for gene E521 in S. dioica because no variants were found in the sequenced region of this gene in this species. A full color version of this figure is available at the Heredity journal online.

