
Figure 4.
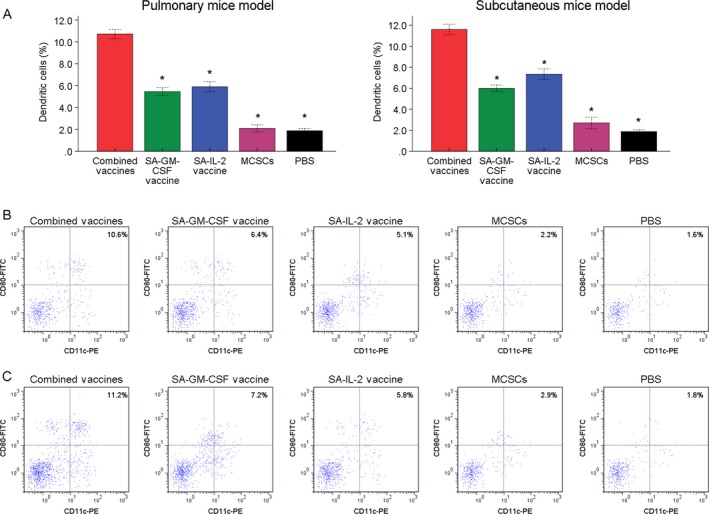
(A) In FCM analysis, the portion of DCs (CD11c+ CD80+) in the combined vaccines group was more than other four groups significantly. (B) The typical image of DCs in pulmonary mice model. (C) The typical image of DCs in subcutaneous mice model. *P < 0.05 (vs. combined vaccines group). FCM, flow cytometry assay.