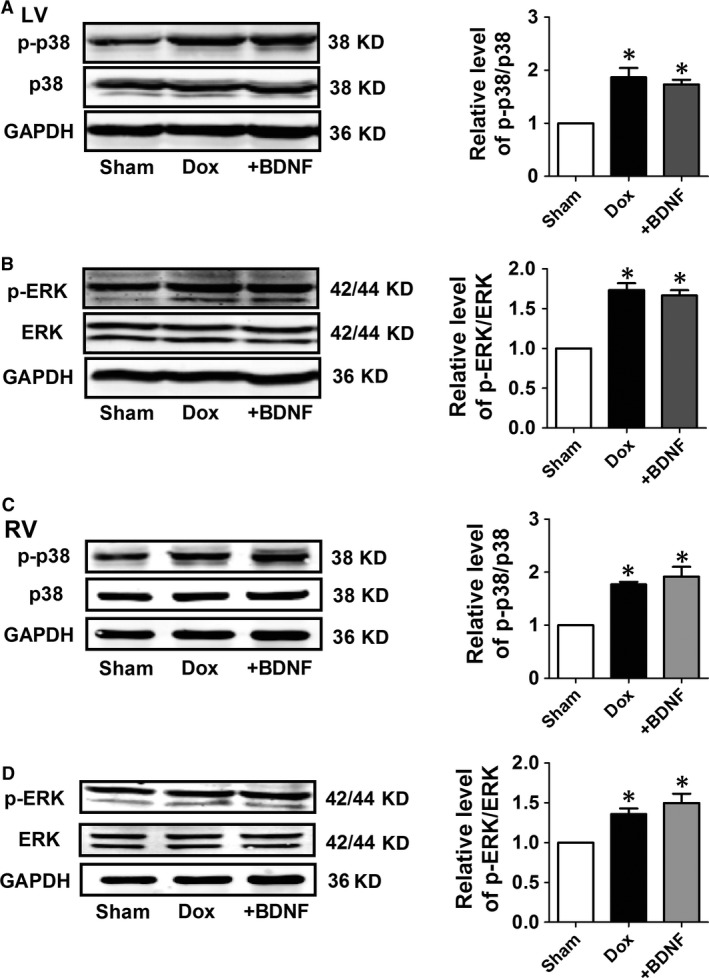
Figure 6.

Protein expression of p38 and ERK in Dox and BDNF‐treated left and right rat ventricles. (A and C) Representative western blot bands and statistical results of p‐p38 and p38 of left and right ventricles. (B and D) Representative western blot bands and statistical results of p‐ERK and ERK of left and right ventricles. *P < 0.05 versus sham, n = 5 each group.
