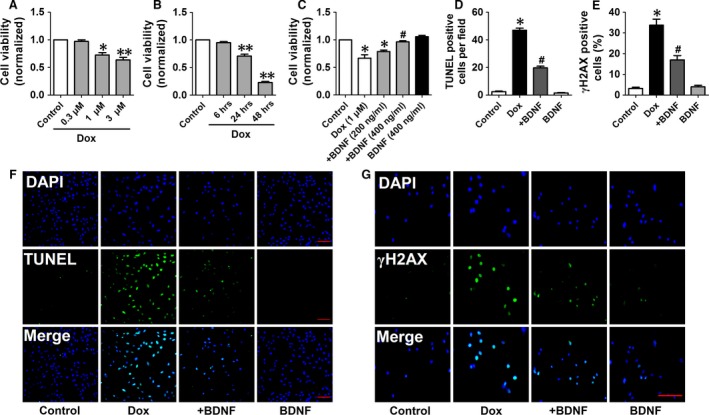
Figure 7.

BDNF antagonized Dox‐induced toxicity of H9c2 cells. (A) Effect of different concentrations of BDNF including 0.3, 1, 3 μM for 24 hrs on cell viability of H9c2 cells. (B) Effect of different durations of BDNF including 6, 24 and 48 hrs at 1 μM on cell viability of H9c2 cells. (C) Effect of BDNF (200, 400 ng/ml) on Dox (1 μM)‐treated cell toxicity of H9c2 cells. (D) BDNF reduced apoptotic rate in Dox‐induced H9c2 cells. (E) BDNF decreased γH2AX positive cells in Dox‐induced H9c2 cells. (F) Representive images of TUNEL staining showing the apoptotic cells (stained in green) and nucleus (stained in blue with DAPI), scale bar: 100 μM. (G) Representive images of γH2AX staining showing the DNA damage (stained in green) and nucleus (stained in blue with DAPI), scale bar: 100 μM. *P < 0.05, **P < 0.01, versus control, #P < 0.05 versus Dox, n = 5 each group.
