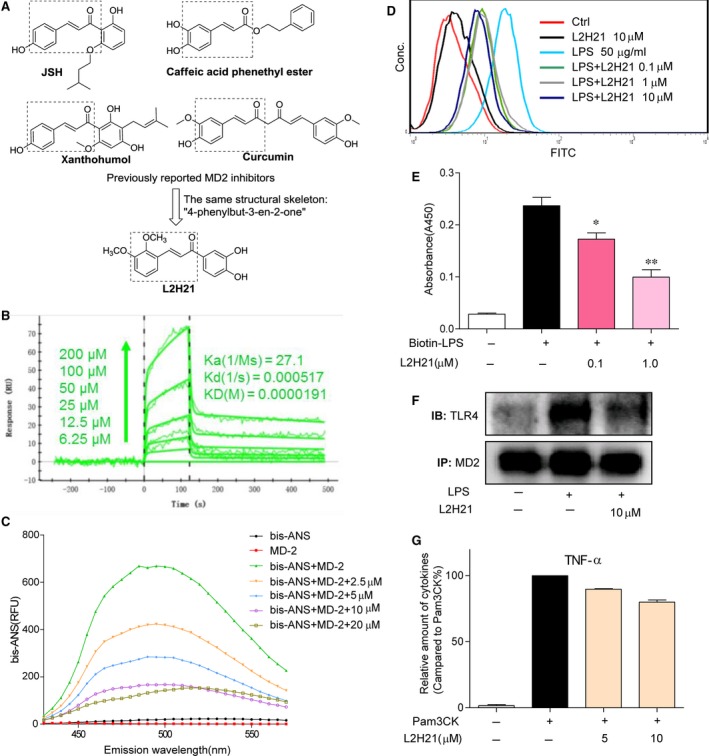
Figure 1.

Antagonistic effect of L2H21 on LPS binding to rhMD‐2. (A) Chemical structures of current MD‐2 inhibitors and L2H21. (B) The binding affinity between L2H21 and rhMD‐2 was carried out by SPR. (C) After bis‐ANS (5 μM) pre‐incubated with rhMD‐2 (5 nM) to reach stable fluorescence values under excitation at 380 nm, then treated with L2H21 for 5 min. Emission spectra at 430–570 nm are represented as relative fluorescence units (RFUs). (D) HUVECs were incubated with DMSO alone (Ctrl), L2H21 (10 μM), FITC‐LPS (50 μg/ml) plus L2H21 (0.1 μM), FITC‐LPS (50 μg/ml) plus L2H21 (1 μM), FITC‐LPS (50 μg/ml) plus L2H21 (10 μM) or FITC‐LPS (50 μg/ml) alone for 30 min. These cells were collected and subjected to flow cytometry analysis. (E) The 96‐well plates for ELISA were coated with rhMD‐2 antibody at 4°C overnight. Then, rhMD‐2 protein was added to the plate and biotin‐LPS was added or not to the plate in the presence or absence of L2H21 (0.1 or 1 μM). LPS binding to rhMD‐2 was determined by ELISA, representing as absorbance values at 450 nm. Data are mean ± S.E.M. of three separate experiments performed in duplicate (*P < 0.05 and **P < 0.01 versus buffer‐alone‐added group). (F) MPMs (1 × 10⁶) were stimulated with LPS (1 μg/ml) for 5 min. in the presence or absence of L2H21 (10 μM). Cell extracts were subjected to the immunoprecipitation with anti‐MD‐2 antibody. Then the immune complexes were then immunoblotted with anti‐TLR4 and anti‐MD‐2 antibody. (G) RAW 264.7 macrophages (5 × 10⁵) were stimulated with Pam3CK (0.1 μg/ml) for 12 hrs in the presence or absence of L2H21 (5 and 10 μM), then the cytokine TNF‐ɑ level in the medium was detected by ELISA.
