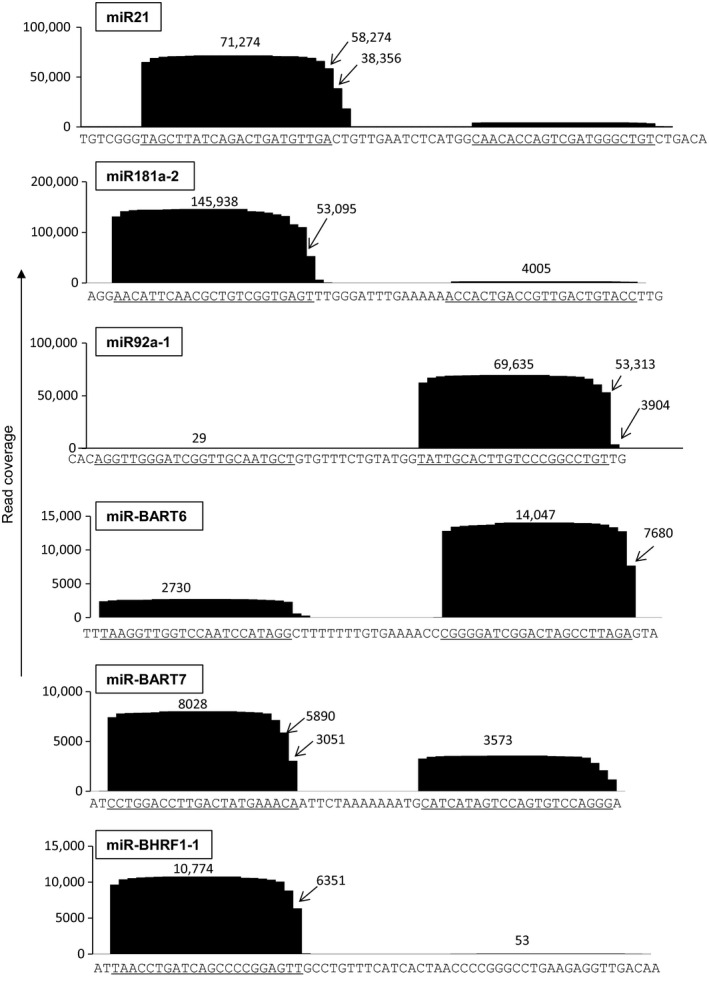
Figure 4.

Coverage of reads in each pre‐miRNA in spontaneously transformed LCL samples. Three frequent cellular and EBV miRNAs are shown. Sequences of pre‐miRNAs are shown under the figures. Under bars indicate 5p and 3p miRNAs. Vertical axis indicates coverage (reads). EBV, Epstein–Barr virus.
