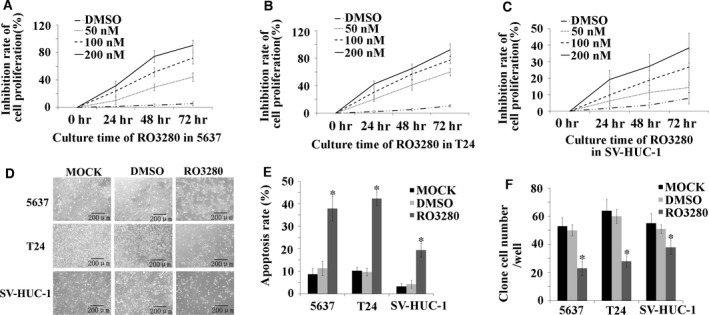
Figure 1.

Cytotoxicity of RO3280 in 5637 and T24 cell lines and the SV‐HUC‐1 cell line. (A–C) The MTT assay was used to examine the proliferation of 5637, T24 and SV‐HUC‐1 cells that were treated with 50, 100 and 200 nM RO3208, treated with an equal amount of DMSO (DMSO) or received no treatment (MOCK). (D) Visualization by inverted microscopy (100X) for the morphological effects of RO3280 in 5637, T24 and SV‐HUC‐1 cells. (E) Apoptotic effects of RO3280 in 5637, T24 and SV‐HUC‐1 cells were observed using PI staining and are shown using bar graphs (*P < 0.05). (F) Bar graphs show the clonogenic survival of 5637, T24 and SV‐HUC‐1 cells exposed to RO3280 (*P < 0.05); the error bars indicate the S.E.M.
