Figure 2.

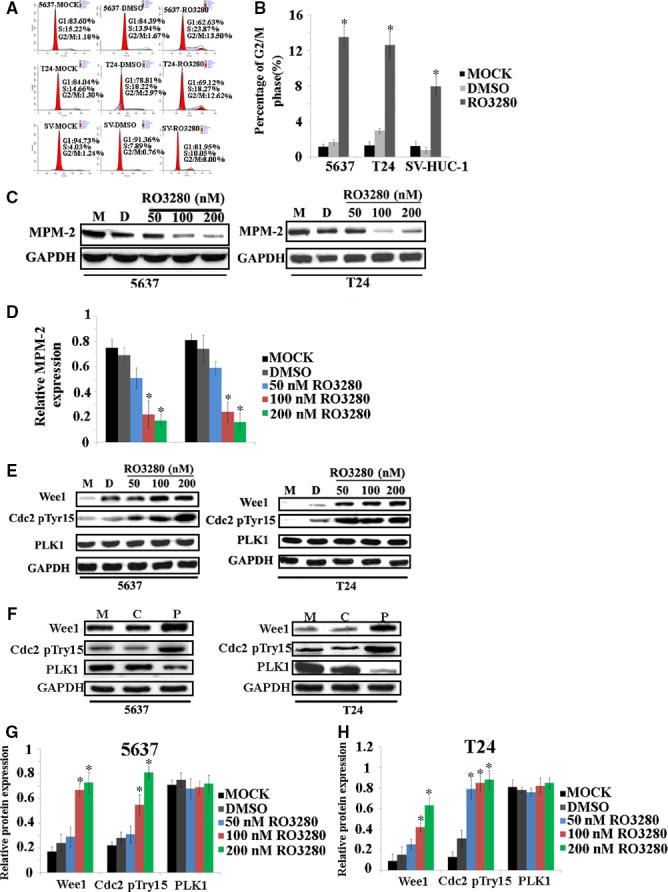
The influence of RO3280 on the cell cycle in 5637, T24 and SV‐HUC‐1 cells. (A) Cell cycle distributions of 5637, T24 and SV‐HUC‐1 cells were evaluated using a flow cytometer after RO3280 treatment (100 nM, 48 hrs). (B) Histograms represent the cell cycle distribution, and the ratios were calculated (*P < 0.05). (C) Band intensities indicate the MPM‐2 protein expression level in 5637 and T24 cells exposed to RO3280. GAPDH was used as a loading control to assure equal amounts of protein in all lanes. (D) The ratio of the optical density of MPM‐2 and GAPDH of the same sample by Western blot was calculated and expressed graphically. The data are representative of three individual experiments (*P < 0.05). (E and F) Band intensities indicate Wee1, the phosphorylation of CDC2 at Tyr15 and PLK1 protein expression in 5637 and T24 cells that were exposed to RO3280 and with treatment of PLK1 siRNA. M: MOCK group, C: Control group, P: PLK1 siRNA group. (G and H) The ratio of the optical density of Wee1, the phosphorylation of CDC2 at Tyr15, PLK1 and GAPDH of the same sample using Western blotting was calculated and expressed graphically (*P < 0.05); the error bars indicate the S.E.M.
