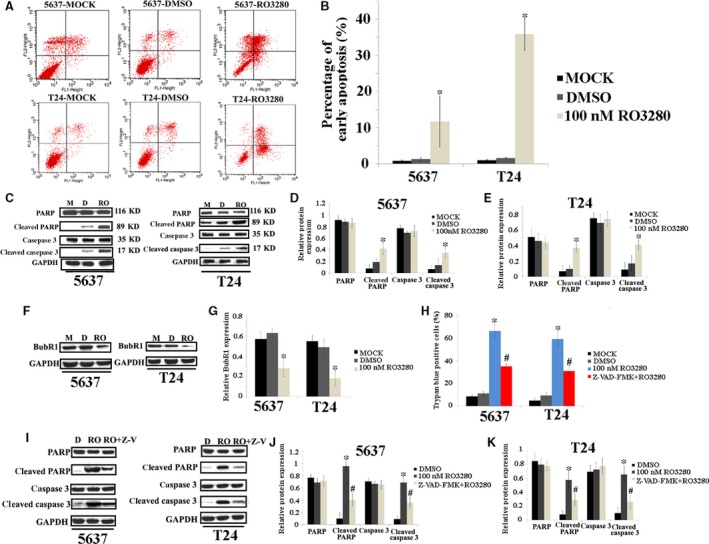
Figure 3.

RO3280 induces the biochemical features of apoptosis in bladder cancer cells. (A) The ability of RO3280 (100 nM, 48 hrs) to induce apoptosis was quantified using Annexin V‐FITC staining with FACS analysis, where Annexin V+ PI +, Annexin V+ PI −, Annexin V− PI + and Annexin V− PI −, respectively, indicate late apoptotic, early apoptotic, necrotic and live cells. (B) The bar chart represents the number of apoptotic cells and the ratios were calculated (*P < 0.05). (C) Band intensities indicated PARP, cleaved PARP, caspase 3 and cleaved caspase 3 protein expression in 5637 and T24 cells that were exposed to RO3280 (100 nM, 48 hrs). (D and E) The ratio of the optical density of PARP, cleaved PARP, caspase 3, cleaved caspase 3 and GAPDH of the same sample using Western blotting was calculated and expressed graphically (*P < 0.05). (F) Band intensities indicated BubR1 protein expression in 5637 and T24 cells that were exposed to RO3280 (100 nM, 48 hrs). (G) The ratio of the optical density of BubR1 and GAPDH for the same sample using Western blotting was calculated and expressed graphically (*P < 0.05). (H) 5637 and T24 cells were treated with RO3280 (100 nM, 48 hrs) or RO3280 (100 nM, 48 hrs)+ Z‐VAD‐FMK for 48 hrs, and cell death was determined by trypan blue staining (*, compared with MOCK and DMSO groups; #, compared with RO3280 group; P < 0.05). (I) Band intensities indicated PARP, cleaved PARP, caspase 3 and cleaved caspase 3 protein expression in 5637 and T24 cells that were exposed to RO3280 (100 nM, 48 hrs) or RO3280 (100 nM, 48 hrs)+ Z‐VAD‐FMK. (J and K) The ratio of the optical density of PARP, cleaved PARP, caspase 3, cleaved caspase 3 and GAPDH of the same sample using Western blotting was calculated and expressed graphically [*, compared with MOCK and DMSO groups; #, compared with RO3280 (100 nM, 48 hrs) group; P < 0.05]; the error bars indicate the S.E.M.
