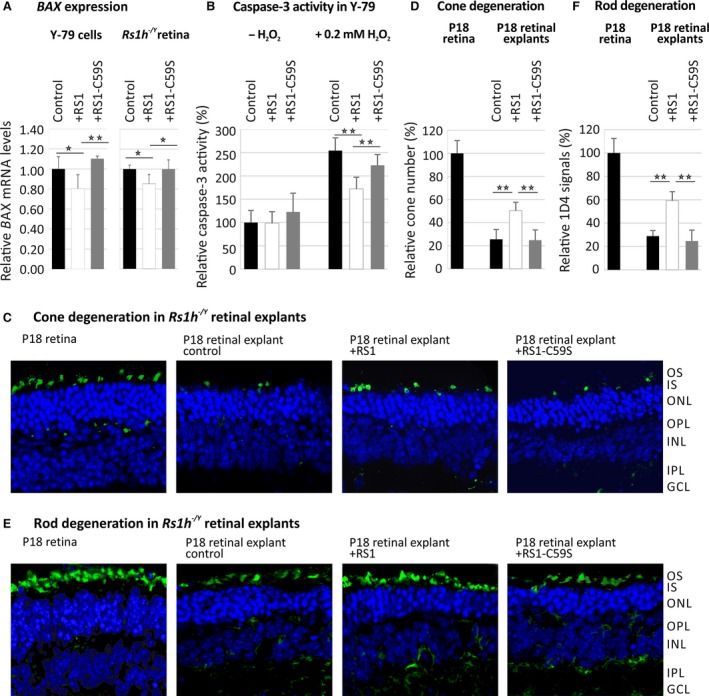
Figure 6.

Influence of retinoschisin on apoptosis. (A) Retinoschisin‐dependent BAX expression in Y‐79 cells and murine Rs1h −/Y retinal explants. Y‐79 cells or retinal explants were treated with retinoschisin, RS1‐C59S or control protein for 20 hrs or 30 min., respectively. BAX mRNA expression was determined via quantitative real‐time RT‐PCR. Five independent experiments were performed. Results were normalized to HPRT transcript levels and calibrated with the control. The mean + S.D. for the five independent experiments is given. Asterisks mark statistically significant (*P < 0.05) and highly significant (**P < 0.01) differences. (B) Retinoschisin‐dependent activation of caspase‐3 in Y‐79 cells subjected to oxidative stress. Y‐79 cells, exposed to retinoschisin, RS1‐C59S or control protein were treated with 0.2 mM H2O2 for 2 hrs. About 18 hrs later, apoptosis was assayed by following caspase‐3‐specific proteolytic activity. Data represent the mean + S.D. of six independent experiments. Asterisks mark statistically highly significant differences (**P < 0.01). (C–F) Retinoschisin‐dependent photoreceptor degeneration in murine Rs1h −/Y retinal explants. Retinal explants harvested 18 days after birth (P18) were cultured for 1 week in medium containing retinoschisin, RS1‐C59S or control protein (purified from supernatant of empty expression vector‐transfected cells). After washing and embedding, cryosections of these explants were subjected to staining for nuclei, cones and rods. OS, outer segments; IS, inner segments; ONL, outer nuclear layer; OPL, outer plexiform layer; INL, inner nuclear layer; IPL, inner plexiform layer; GCL, ganglion cell layer. DAPI staining shows the nuclei of the different retinal layers. (C) Alexa488‐conjugated peanut agglutinin (PNA) staining was applied to visualize cones. (D) The total number of cones per analyzed section was counted after staining with PNA. (E) Anti‐Rho‐1D4 antibody staining was applied to visualize rod specific Rhodopsin. (F) Rhodopsin signals per analyzed section were measured using ImageJ (imagej.nih.gov). Data represent the mean + SD. Asterisks mark statistically highly significant differences (**P < 0.01).
