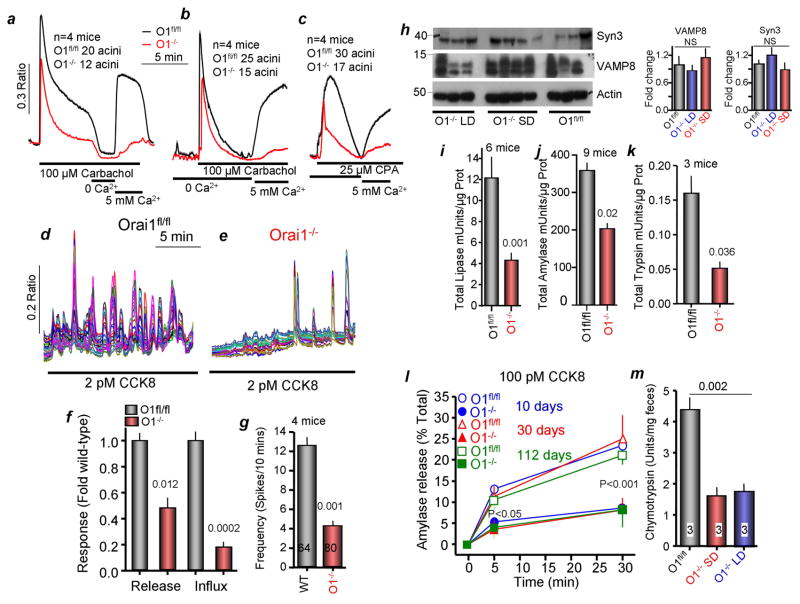
Figure 2. Effect of deletion of Orai1 on Ca2+ signaling, enzymes content and exocytosis.
All experiments are with Orai1fl/fl mice maintained on solid diet (controls) and Orai1−/− mice maintained on liquid diet for 10 days after last gavage with Tamoxifen, except in (m).
(a) Ca2+ signaling evoked by carbachol stimulation in Orai1fl/fl (black trace) and Orai1−/− (red trace) acinar cells in Ca2+ containing medium. Where indicated the cells were exposed to 0 and 5 mM external Ca2+ to assay Ca2+ influx.
(b, c) Acinar cells in Ca2+-free solution were stimulated with 100 μM carbachol (b) or 25 μM CPA (c) to assay Ca2+ release from stores and then exposed to 5 mM external Ca2+ to determine store-operated Ca2+ influx. Traces in (a–c) are mean±s.e.m of the number of acini obtained from 4 mice of each line. Each acinus comprised of 5–10 cells.
(d, e) Orai1fl/fl (d) and Orai1−/− acinar cells (e) were stimulated with 2 pM CCK8 to evaluate receptor-stimulated Ca2+ oscillations.
(f) Summary of Ca2+ release and influx. Here and in (g, i, k) the p values are listed in the columns.
(g) Summary of Ca2+ oscillation frequency recorded in 64 Orai1fl/fl and 80 Orai1−/− acinar cells.
(h) Protein levels of the granule markers syntaxin 3 and VAMP8, and of actin. The columns show the average staining intensity relative to actin and is plotted as mean±s.e.m.
(i–k) Activity of total lipase (i, 6 mice), amylase (j, 9 mice) and trypsin (k, 3 mice) in Orai1fl/fl (black) and Orai1−/− acinar cells (red).
(l) Time course of exocytosis stimulated by 100 pM CCK8 in acini obtained from age-matched Orai1fl/fl and Orai1−/− mice 10 (blue, circles), 30 (red, triangles) and 112 (green, squares) days after deletion of Orai1.
(m) Chymotrypsin in feces of Orai1fl/fl mice (black) and Orai1−/− mice maintained on solid (red) and liquid diets (blue) for 10 days after final Tamoxifen gavage.

