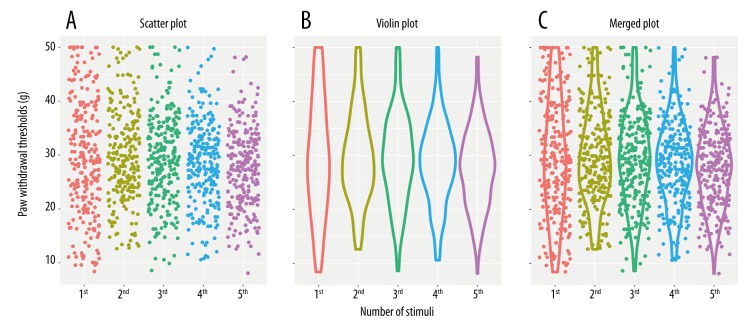
Figure 2.
Individual paw withdrawal thresholds to mechanical stimuli of previous mechanosensitivity measurements in 244 rats. (A) Scatter plots illustrate the distribution of withdrawal threshold values, where each dot represents a withdrawal threshold. (B) Violin plots reveal the heterogeneity in the population by visualizing the density of withdrawal threshold values at each time. (C) Merged plots of scatter plots and violin plots.

