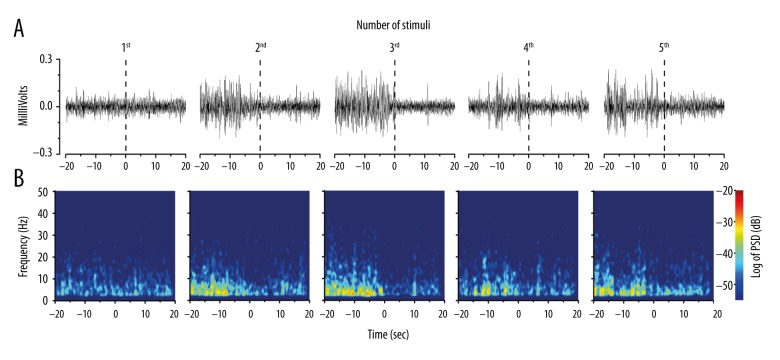
Figure 3.
Mechanical stimulus-induced oscillatory activity of the rACC during each successive stimulus. (A) Representative examples of spontaneous LFP recordings (band pass filtered between 2 and 45 Hz). (B) Spectrograms of the same LFP signals as in (A). The power was normalized by the logarithm of the PSD (in decibels) within the frequency range (2–45 Hz). The inspection of amplitude (A) and PSD (B) indicated higher pre-stimulus LFP amplitudes preceding the last four stimuli relative to the first. rACC – rostral anterior cingulate cortex; LFP – local field potential; PSD – power spectral density.

