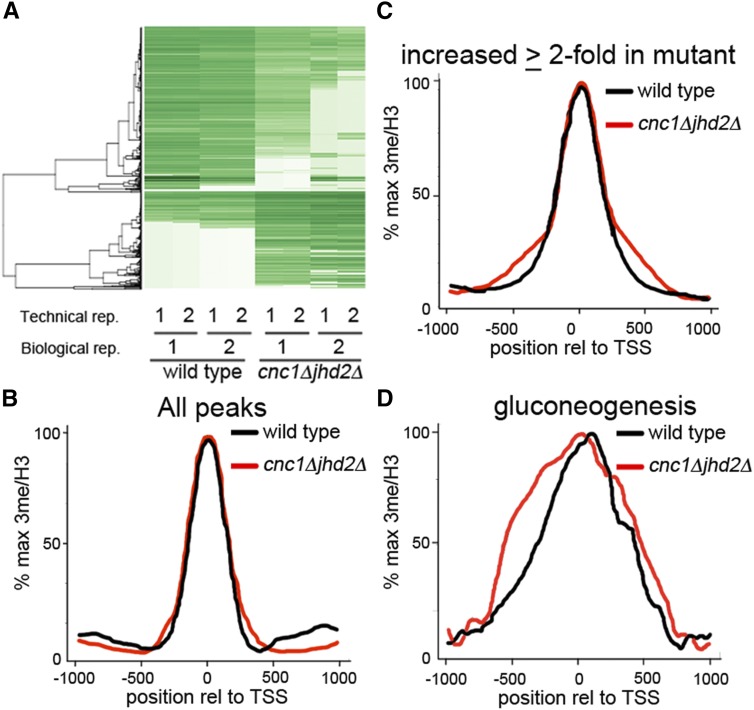
Figure 1.
Differential peak identification and H3Lys4 3me distribution relative to TSS. (A) Hierarchical clustering of differential H3Lys4 3me peaks as determined by DiffBind. After peak calling, wild type and cnc1Δjhd2Δ mutants were analyzed for differential peaks. For each genotype, two biological replicates with two technical sequencing replicates were performed. Green = strong peak, white = no peak. (B–D) Distribution of H3Lys4 3me relative to histone H3 across the TSS for (B) all peaks (C) peaks that are ≥twofold elevated in cnc1Δjhd2Δ mutants, and (D) peaks for genes involved in gluconeogenesis. H3Lys4 3me, histone H3Lys4 trimethylation; TSS, transcriptional start sites.

