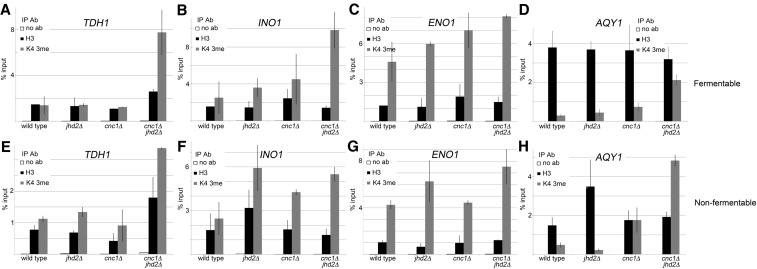
Figure 2.
ChIP-qPCR measuring H3Lys4 3me and histone H3 abundance at differentially bound loci for yeast cultured in fermentable and nonfermentable carbon. ChIP-qPCR was performed for wild type, jhd2Δ, cnc1Δ, and cnc1Δjhd2Δ mutants cultured to midlogarithmic phase in either fermentable (top) or nonfermentable (bottom) carbon. qPCR reactions targeted loci displaying enrichment as determined by ChIP-seq; (A and E) TDH1, (B and F) INO1, (C and G) ENO1, and (D and H) AQY1. ChIP signal was calculated by normalization to standard curves for each individual primer pair and then determining the percent input of each immunoprecipitation. Histograms represent the average percent input from three independent biological replicates, error bars are SD. Ab, antibody; ChIP, chromatin immunoprecipitation; ChIP-seq, chromatin immunoprecipitation sequencing; H3Lys4 3me, histone H3Lys4 trimethylation; IP, immunoprecipitation; qPCR, quantitative polymerase chain reaction.

