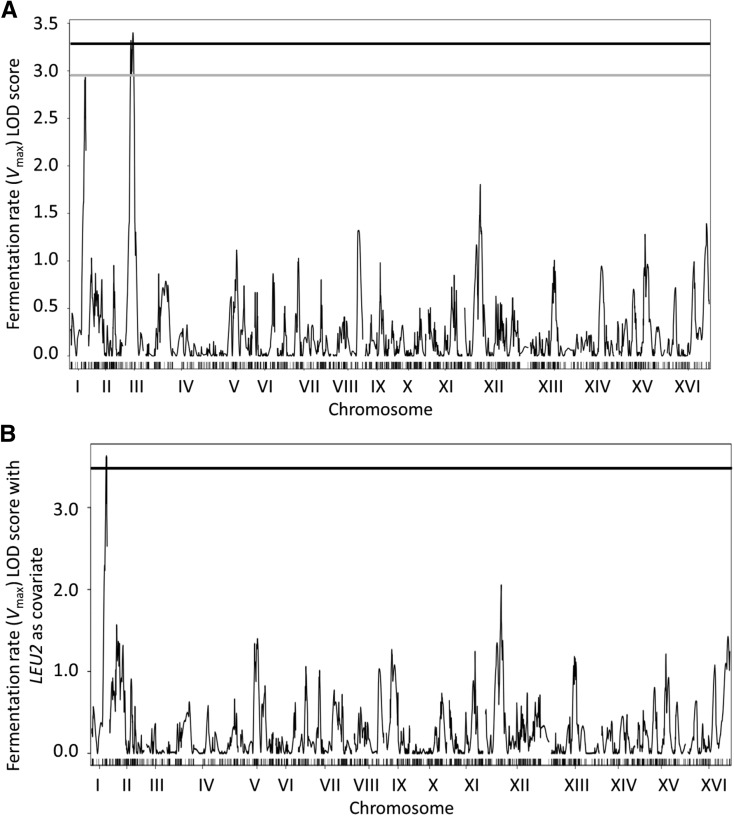
Figure 2.
LOD scores plots of 2957 genetic markers across the 16 yeast chromosomes for Vmax values across 119 BY4716 × RM11-1a F1 progeny. (A) LODplot including the effects of LEU2. The gray and black horizontal lines represent the 10 and 5% significance levels, respectively (determined from 1000 permutations of each trait). (B) LODplot using LEU2 as covariate in a normal model to remove its effect. The black horizontal line represents the 5% significance level. LOD, Logarithm (base 10) of odds.

