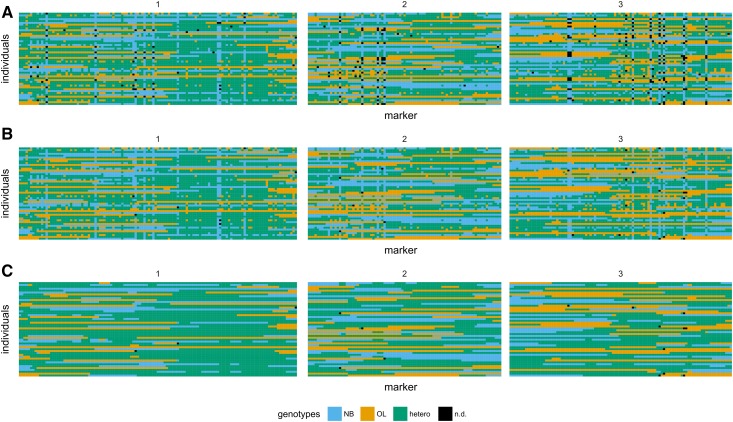
Figure 5.
Graphical representations of GBS-derived genotypes at different stages of post-processing. Shown are graphical representations of genotypes after inferring parental alleles (A), after inferring parental alleles and imputation of missing data (B), and after inferring of parental alleles, imputation, and error correction (C). Genotypes of 50 representative F2 individuals are shown, with each F2 as a single horizontal track. The chromosome length is proportional to the number of markers, and only chromosomes 1 to 3 are shown. In total, 312 markers (fall 2014 population, up to 50% missing data) are displayed, with genotypes color-coded as blue (NB), orange (OL), green (heterozygous), and black (not determined).

